This blog post, written by members of the Library's Information Integrity Team, is part of a series that covers disinformation and other related subjects. The goal is to help create a well-informed citizenry of active participants who shape our world.
Find other InfoIntegrity blog posts here!
Every time we look at the news we seem to be confronted by polls. 47% think this, 36% think that, 17% have no opinion. These numbers are designed to make us feel as though we understand how others think, but what do they really mean? Polling statistics can be complex and are sometimes used in a way to sway opinions rather than simply report on opinions. Here are some things to think about when you come across poll numbers:

Media organizations can write headlines and stories which downplay or highlight the opposite intention of the numbers.
Have you ever read a headline that said something like “42% of Americans say they prefer hot dogs to hamburgers!”? That seems like a big number, right? 42% is almost a majority, hot dogs must be the most popular food! But if you look closer, you’ll realize that means 58% of Americans DON’T prefer hot dogs to hamburgers. While the headline does reflect the real numbers, it has been written in a way to sway your opinion.
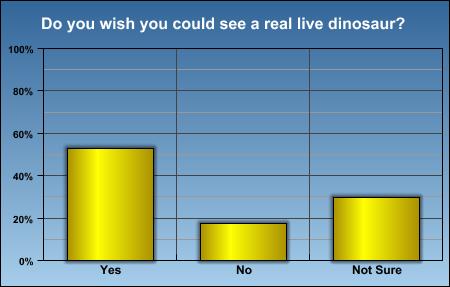
Most news organizations will post the entirety of the poll results towards the end of the article, often in a graph form. If you read beyond the headline, you can see a breakdown of exactly how the respondents answered and get a fuller picture of public opinion.
Polls are created from a cross-section of the public.
Polls are not always run by media companies. Rather, they are typically managed by specific polling organizations who then publish their data. It would be impossible to poll every single person in every single state or country. Most polls have response levels of about 1,500 people; that accounts for roughly .0043% of the population of the United States. Instead, they try to pull a list of people from what is called a cross-section. A cross-section consists of questions of people from various demographics: race, education level, income, religion, and locality (urban, rural, etc.). However, there are limits to what polling organizations can achieve, and some only break down demographics by one or two factors, like party identification or age. Although they try to be as equal and unbiased as possible, there will always be outliers and missed opportunities. Remember that poll numbers are representative of a very small number of people. The statistic that “47% agree” means that 47% of the people asked agree. It helps to have the numbers broken down by groups, too. What if all the people who agree are men, and all the people who disagree are women? The percentage remains the same, but now you have a better idea of who agrees and who doesn’t.
It is possible to see how poll results are reached. The major polling organizations publish all their data. In addition to providing the total number surveyed, they break down all the demographic areas and show how each group answered each question. The math can seem overwhelming, but when you are able to look at the human details you can get a better idea of how certain groups feel about certain things, rather than an overall “47% agree.” This deeper, more nuanced look at other people’s opinions may provide us with a better understanding of our broader society, and what the data actually represents.

Major polling organizations which publish detailed breakdowns and include multiple demographic factors include:
Seeing a poll in the news can give us a sense of security in the information. But it is important to be aware of how those numbers are used or manipulated to achieve a goal or sway opinions. By understanding polls, we can have a much fuller picture of the information we are seeing, reading, and hearing. Next time you see poll numbers used in a news article, try digging a little bit deeper and see what you find!

If you would like to learn more about polls and how they are conducted, the Pew Research Center has an article which serves as an informative “course,” breaking down the process so it is easier to understand.
